Columns in the main tab
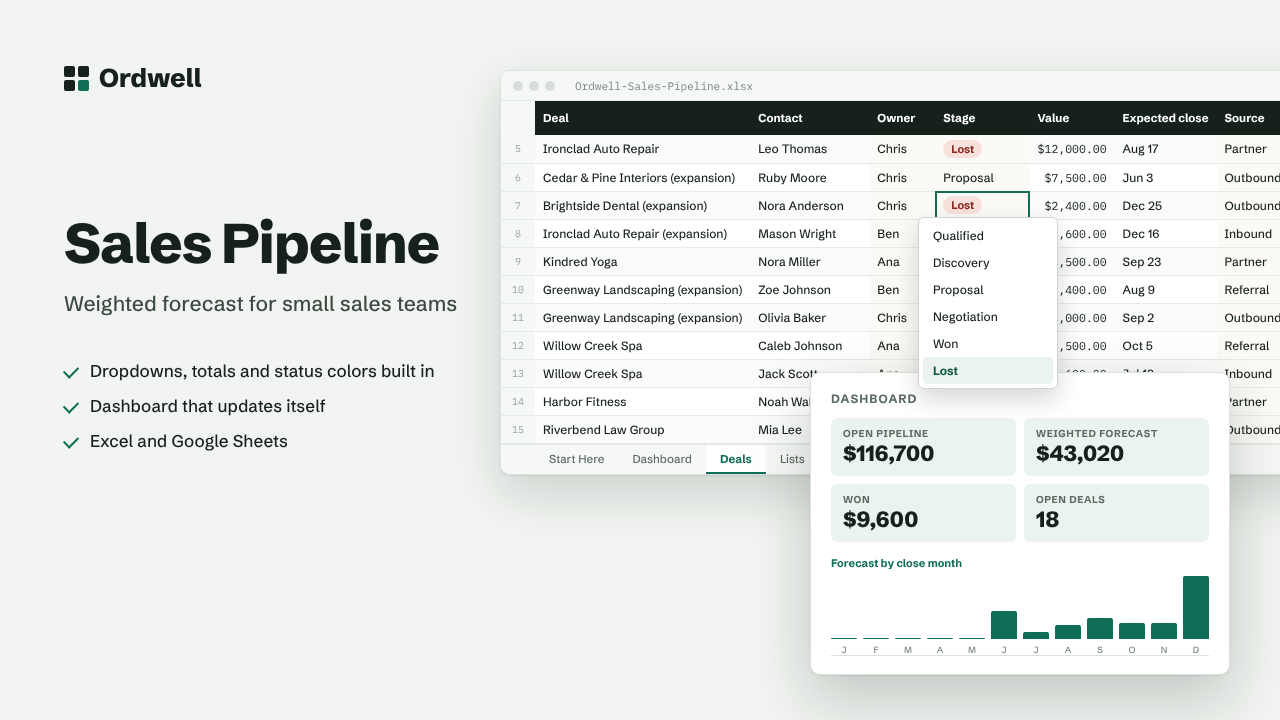
DealContactOwnerStageValueExpected closeSourceProbabilityWeighted
Excel & Google Sheets template
Sales Pipeline Tracker
Weighted forecast for small sales teams
$14
Available this week · $14
- Works inExcel 2010+, Google Sheets
- TabsStart Here, Dashboard, data, Lists
- Rows ready500, formatted
- MacrosNone
- Sample dataIncluded, easy to delete
Need more than one? The Small Business Suite has all ten for $39.
How it works
- Add every deal on the Deals tab with its value, owner, stage and expected close date.
- Each stage has a win probability on the Lists tab. The weighted value is calculated for you.
- The Dashboard shows the forecast by close month, by stage and by sales rep.
- Adjust stage names and probabilities on the Lists tab to fit your sales process.
On the dashboard
- Open pipeline
- Weighted forecast
- Won
- Open deals
- Win rate
- Average deal