Guide
How to track a sales pipeline in Excel
A simple method for B2B sales and small sales teams. Works in Excel and Google Sheets, no macros needed.
Step by step
- Make one row per deal with company, value, stage, probability and expected close date.
- Compute weighted value as deal value times probability.
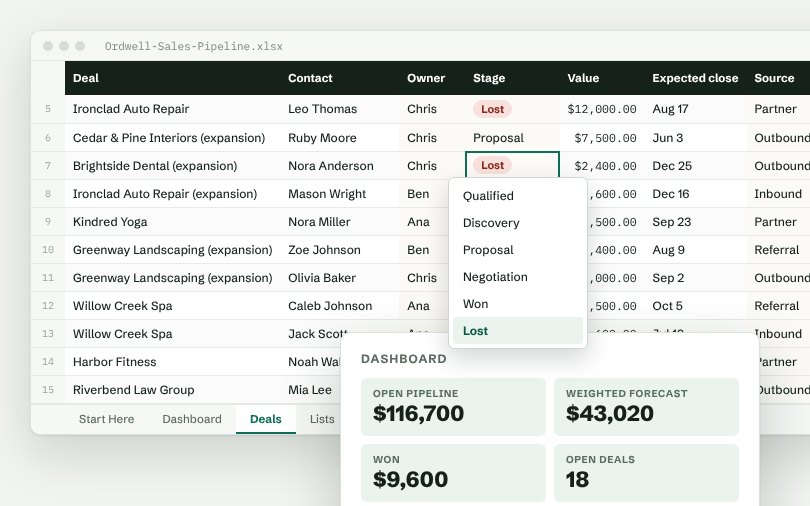
- Use a stage dropdown so you can total value at each stage.
- Sort by close date every week and update stale deals.
- Track win rate by comparing won and lost deals.
Columns to include
Deal, Contact, Owner, Stage, Value, Expected close, Source, Probability.
Numbers worth watching
Open pipeline, Weighted forecast, Won, Open deals, Win rate. Put them at the top of a dashboard tab so you see them every time you open the file.
Skip the setup
The Ordwell Sales Pipeline has all of this built: dropdown lists you control from one tab, formulas in green columns and a dashboard that updates as you type.
Free: Simple Order Log
A real Ordwell spreadsheet with dropdowns, totals and a mini dashboard. Pay what you want, $0 is fine.
More guides
- How to track orders in Excel
- How to manage inventory in Excel
- How to build a simple CRM in Excel
- How to track appointments in Excel
- How to track business expenses in Excel
- How to track projects and tasks in Excel
- How to track purchase orders in Excel
- How to track invoices and payments in Excel
- How to track employee hours in Excel